DT-Meter
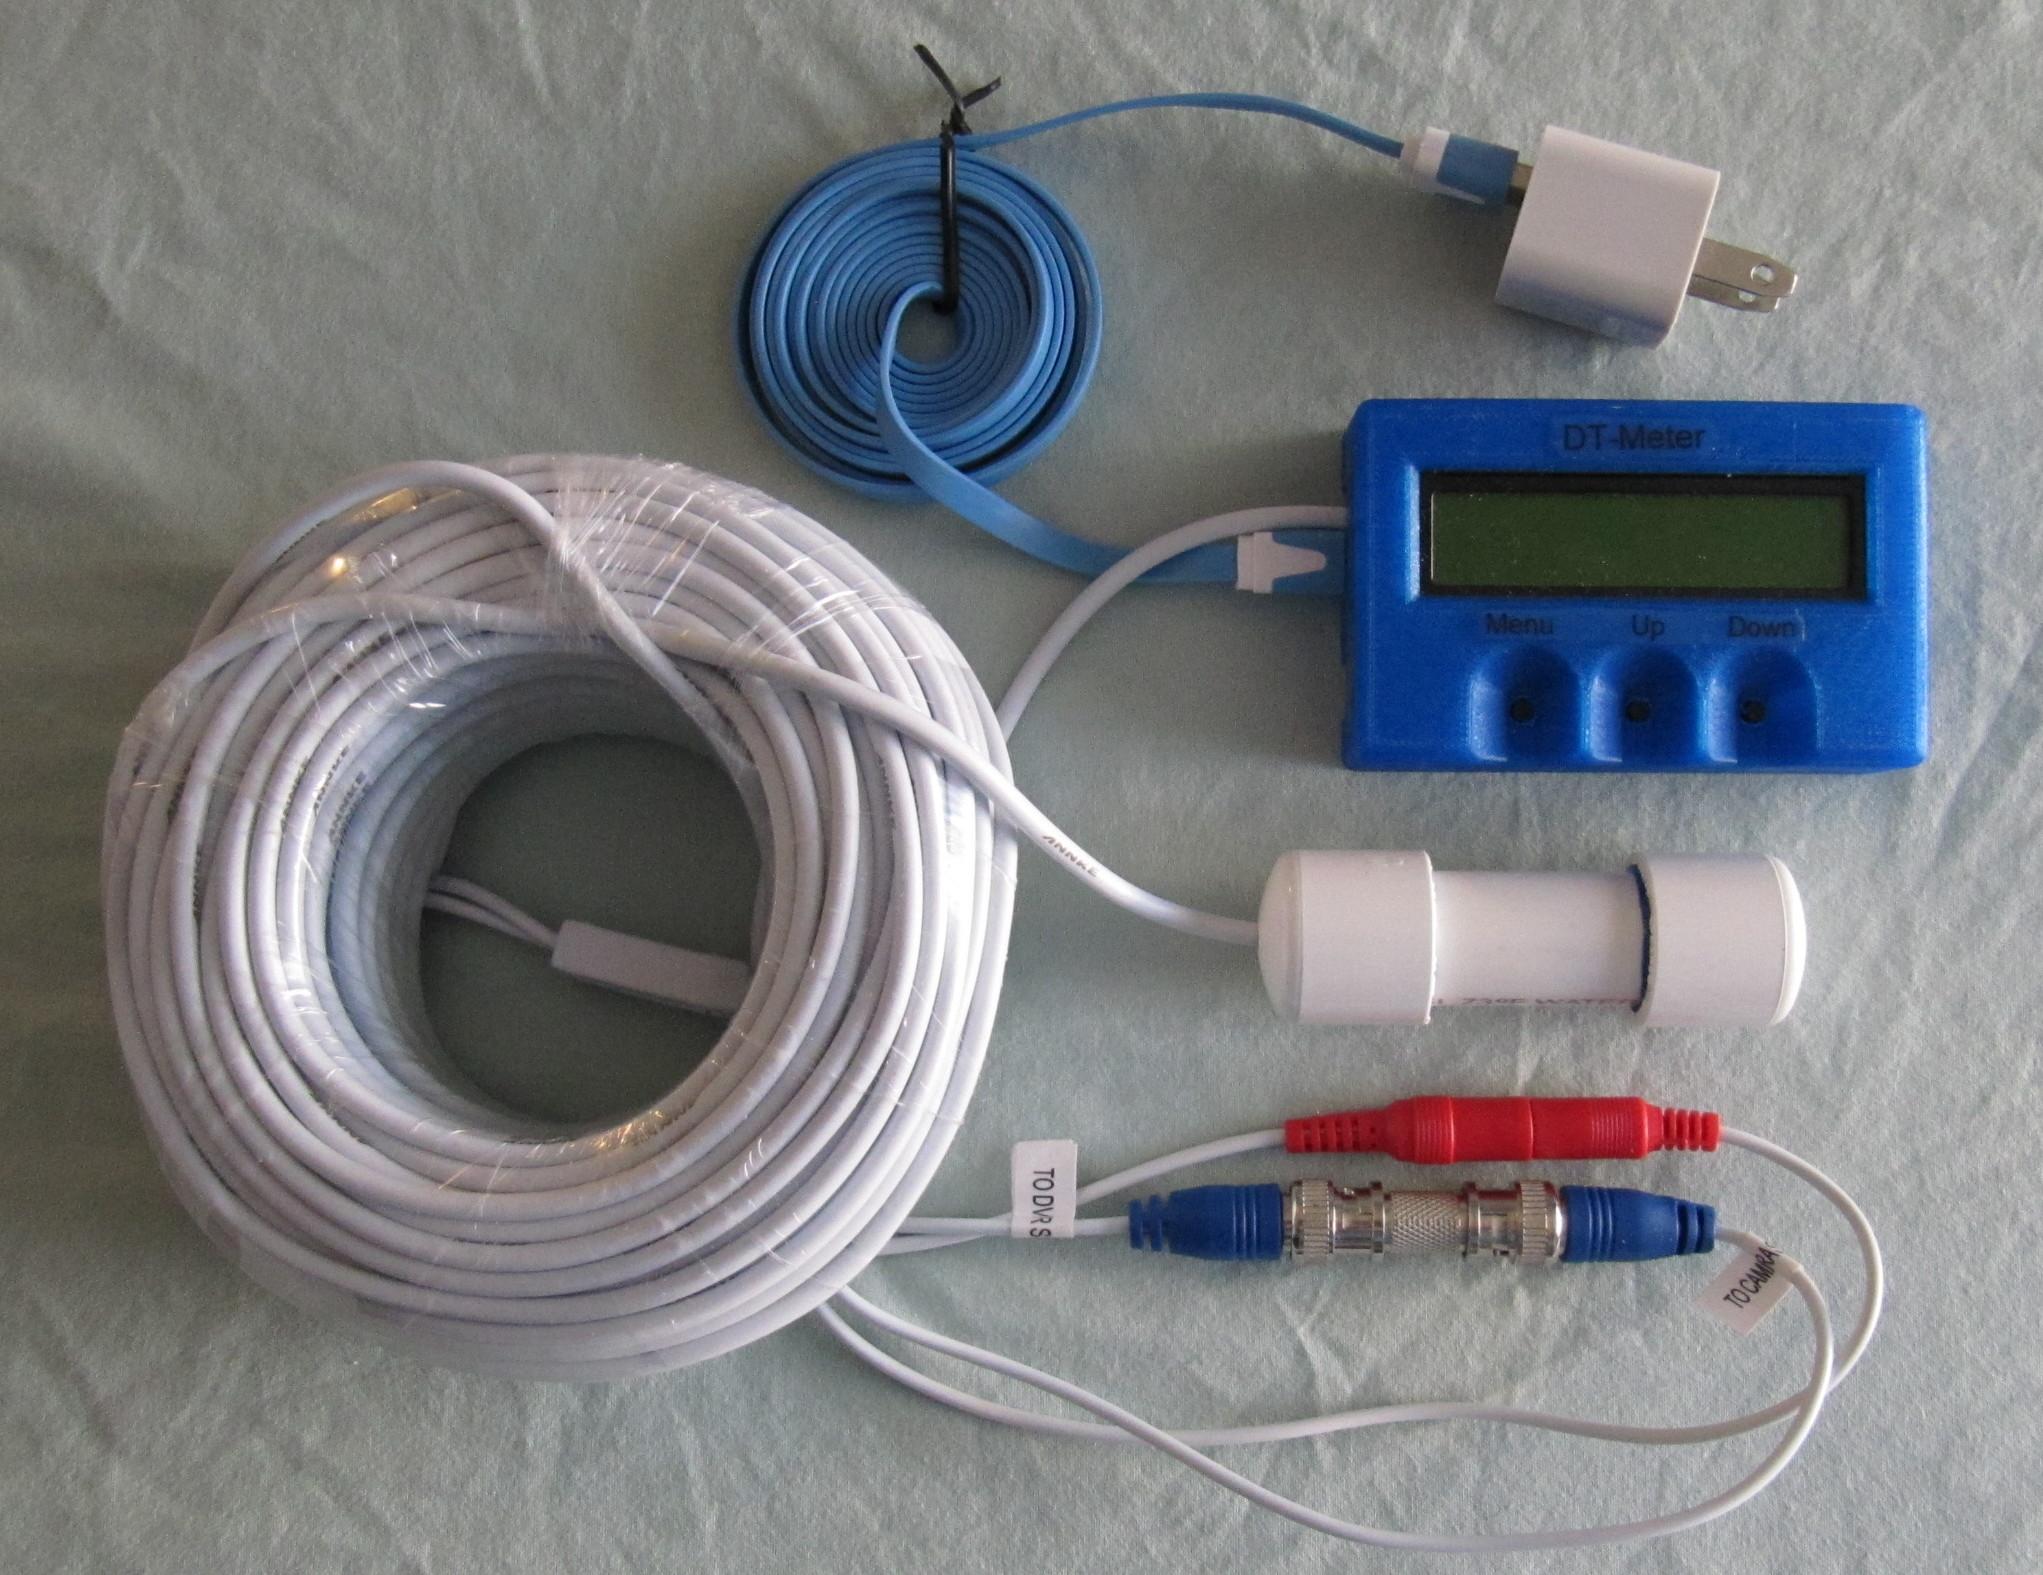
This Differential Time rate Meter displays the difference in time rate between the sensor and the display, in seconds per second. The cable between the sensor and the display unit is 100 feet long, and is included. There is a new nylon case available:
The purpose of owning this meter is to detect and measure the effects of technology that is able to bend space-time. Examples of this technology would be a UFO that bends space-time, or uses gravity as part of it’s propulsion system.
The DT-Meter comes with all required cables and an AC adapter.
If you search Ebay for “DT-Meter” and there are no results, please be patient. The next batch is presently being built and will be available soon.
According to the physics that is taught in school, the reading on this meter should always be 0.0, unless the sensor is rotated around in a 100 foot circle at a very high rate of speed (would damage the cable), or if a black hole begins to approach the earth.
However, this is not true throughout all of experimental physics. There have been experiments done that would tend to validate the possibility of creating a measurable difference in time rate over the distance of 100 feet that would be detectable with this meter.
An example of a local difference in time rate from one place to another that our publicly available technology has produced is from a satellite to the surface of the earth. The satellite has a different time rate due to the combination of it’s motion and the distance from the earth (gravity difference). The time rate difference has been calculated with Einstein's general relativity and measured with atomic clocks to be around 39 micro-seconds per day. The combined noise and drift of this DT-Meter is around 4 or 5 micro-seconds per second, and would therefore not be able to detect this difference.
There have also been reports of places on the earth where natural anomalies exist. It would be nice to know if these anomalies involved a measurable difference in time rate. This DT-Meter is capable of measuring such time rate anomalies with an accuracy of better than +/- 40 millionths of a second.
Distortions in space-time have been reported near hurricanes and funnel clouds, especially near green colored cloud formations. Many of these reports involve material evidence, such as the impossible trip time of an aircraft, or a piece of straw embedded in a window pane in a way that could not have happened in normal space-time. Most reported cases do not have measurements of time-rate differences because an affordable meter has not been available before this DT-Meter (good hunting!).
A reported case of an actual time rate deviation due to a filmed UFO:
Ray Stanford's PROJECT STARLIGHT INTERNATIONAL (now defunct)
recorded several UFO-related E-M disturbances, one in which a
magnetometer, a gravimeter, and a WWV time signal deviated at the
same time. The calibration tone showed that the equipment was
operating normal. This occurred on July 19, 1978 with two UFOs
filmed.
Operation:
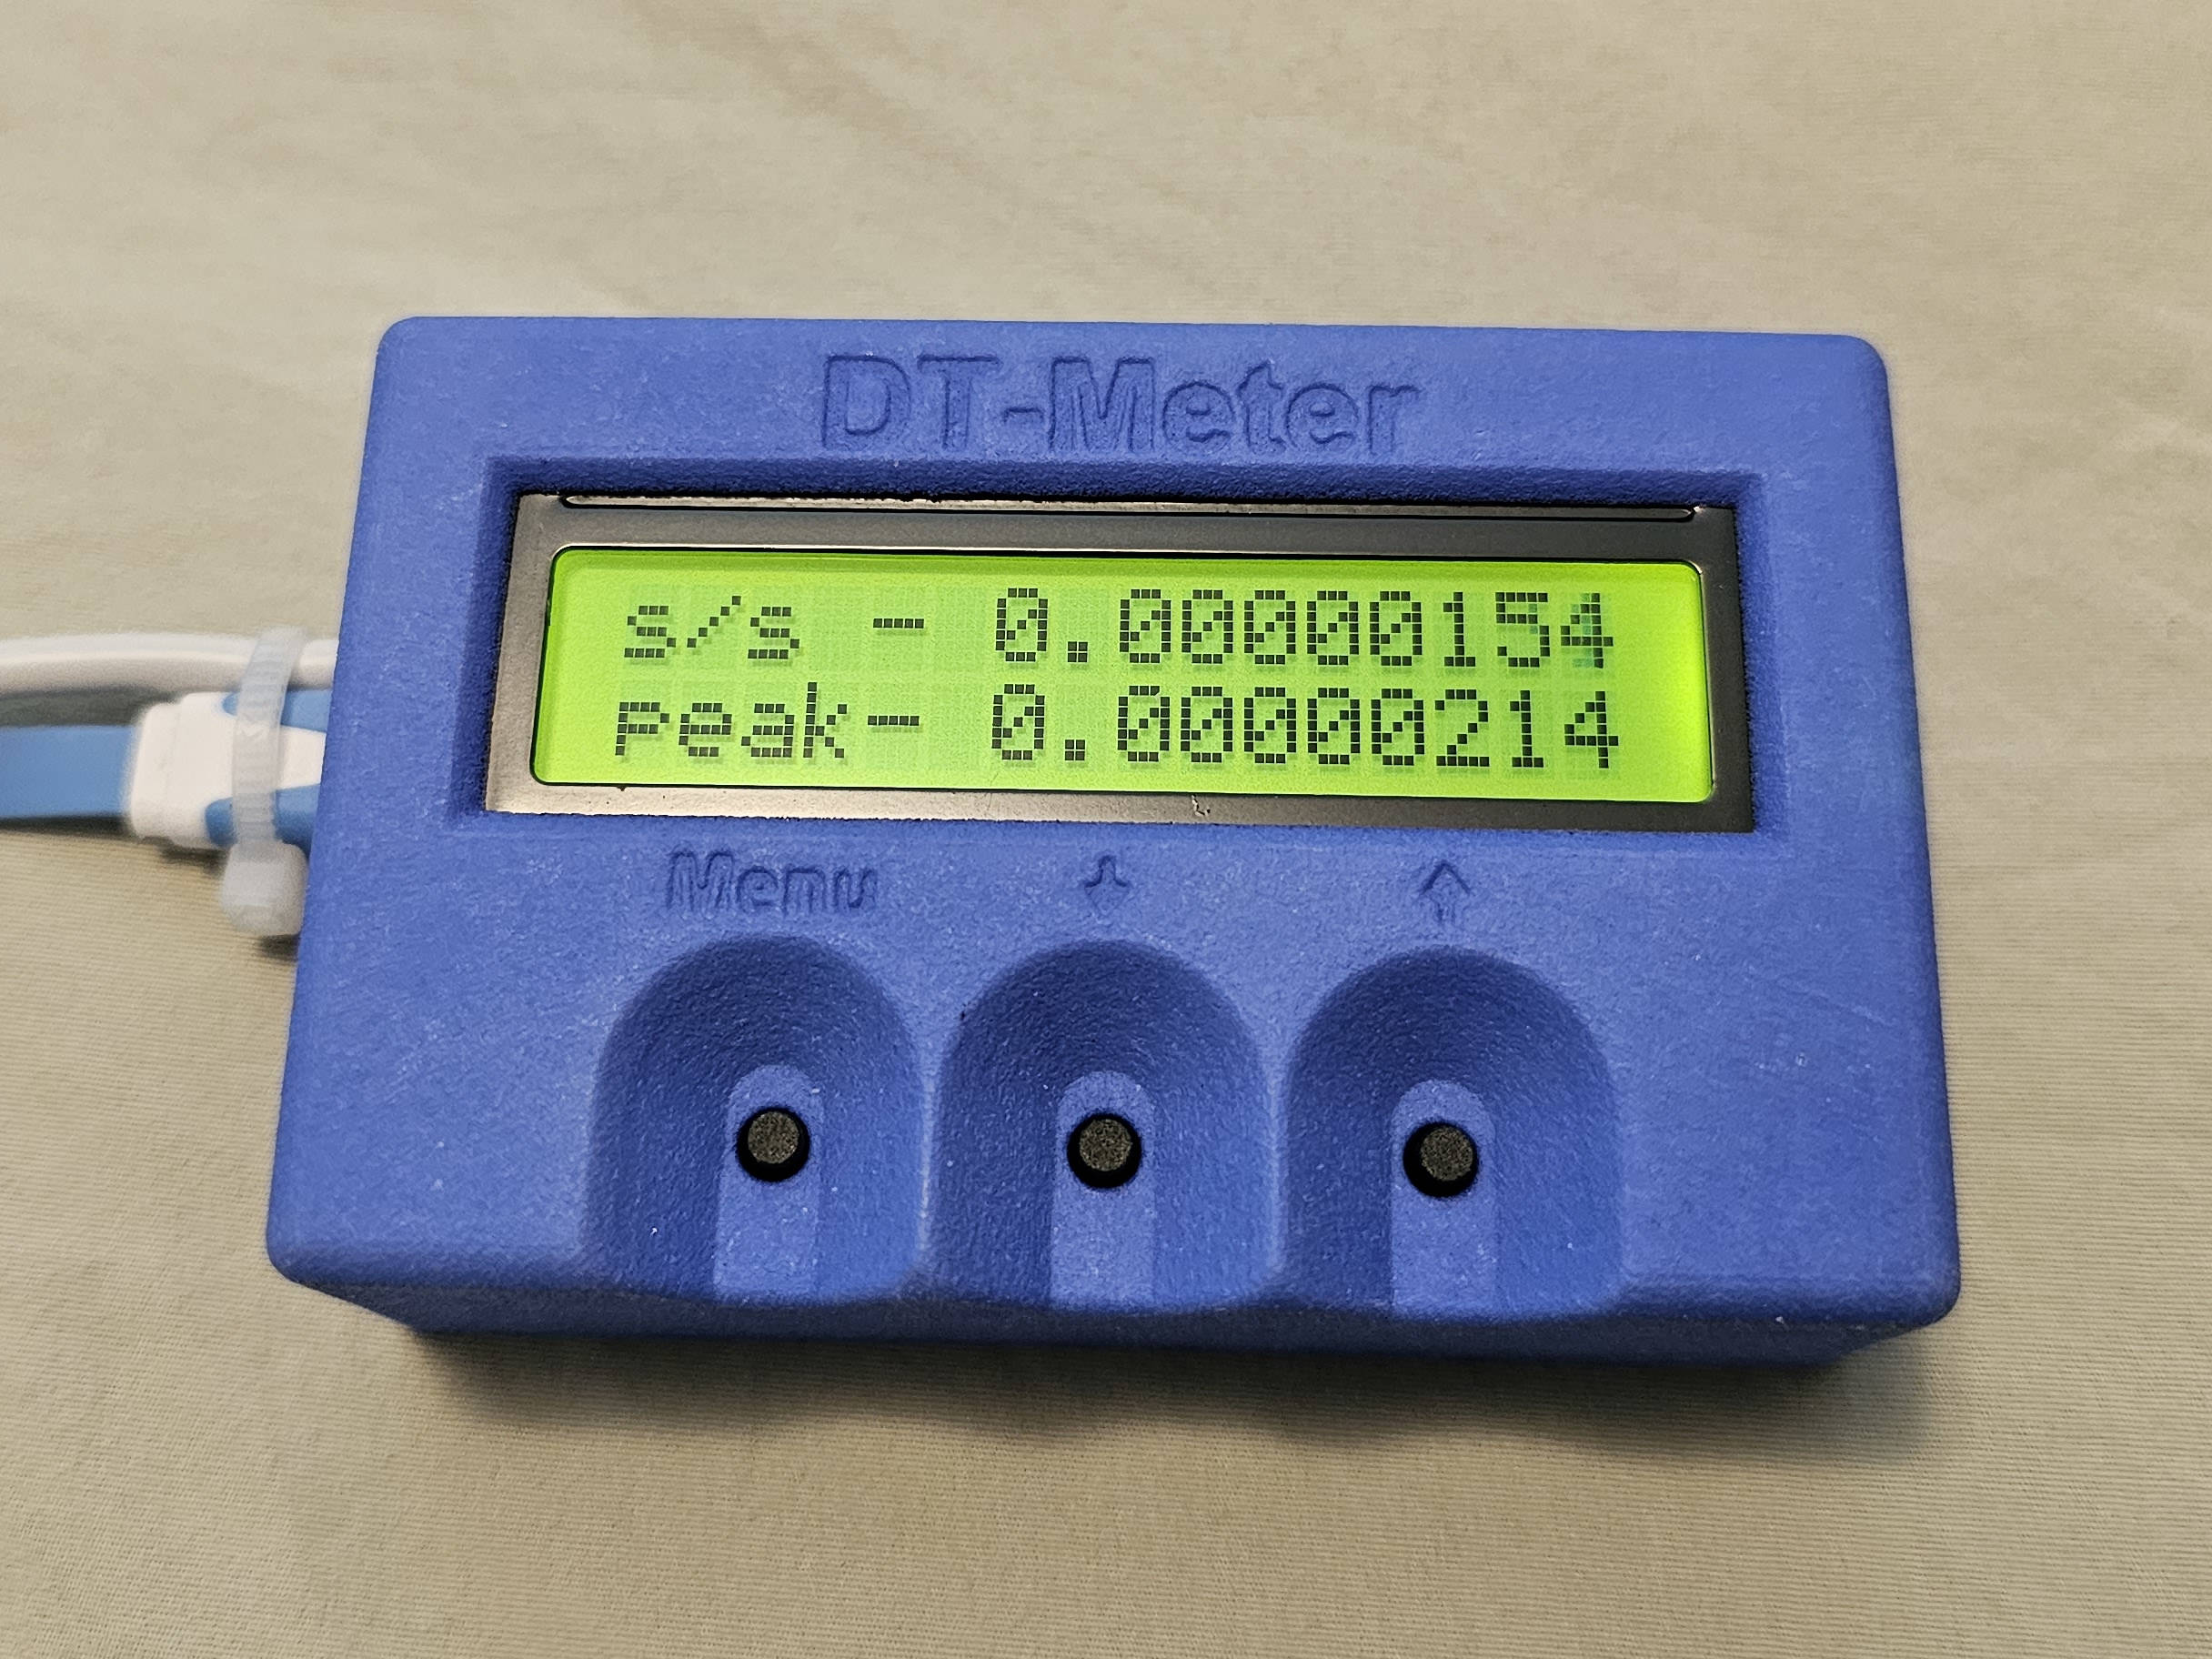
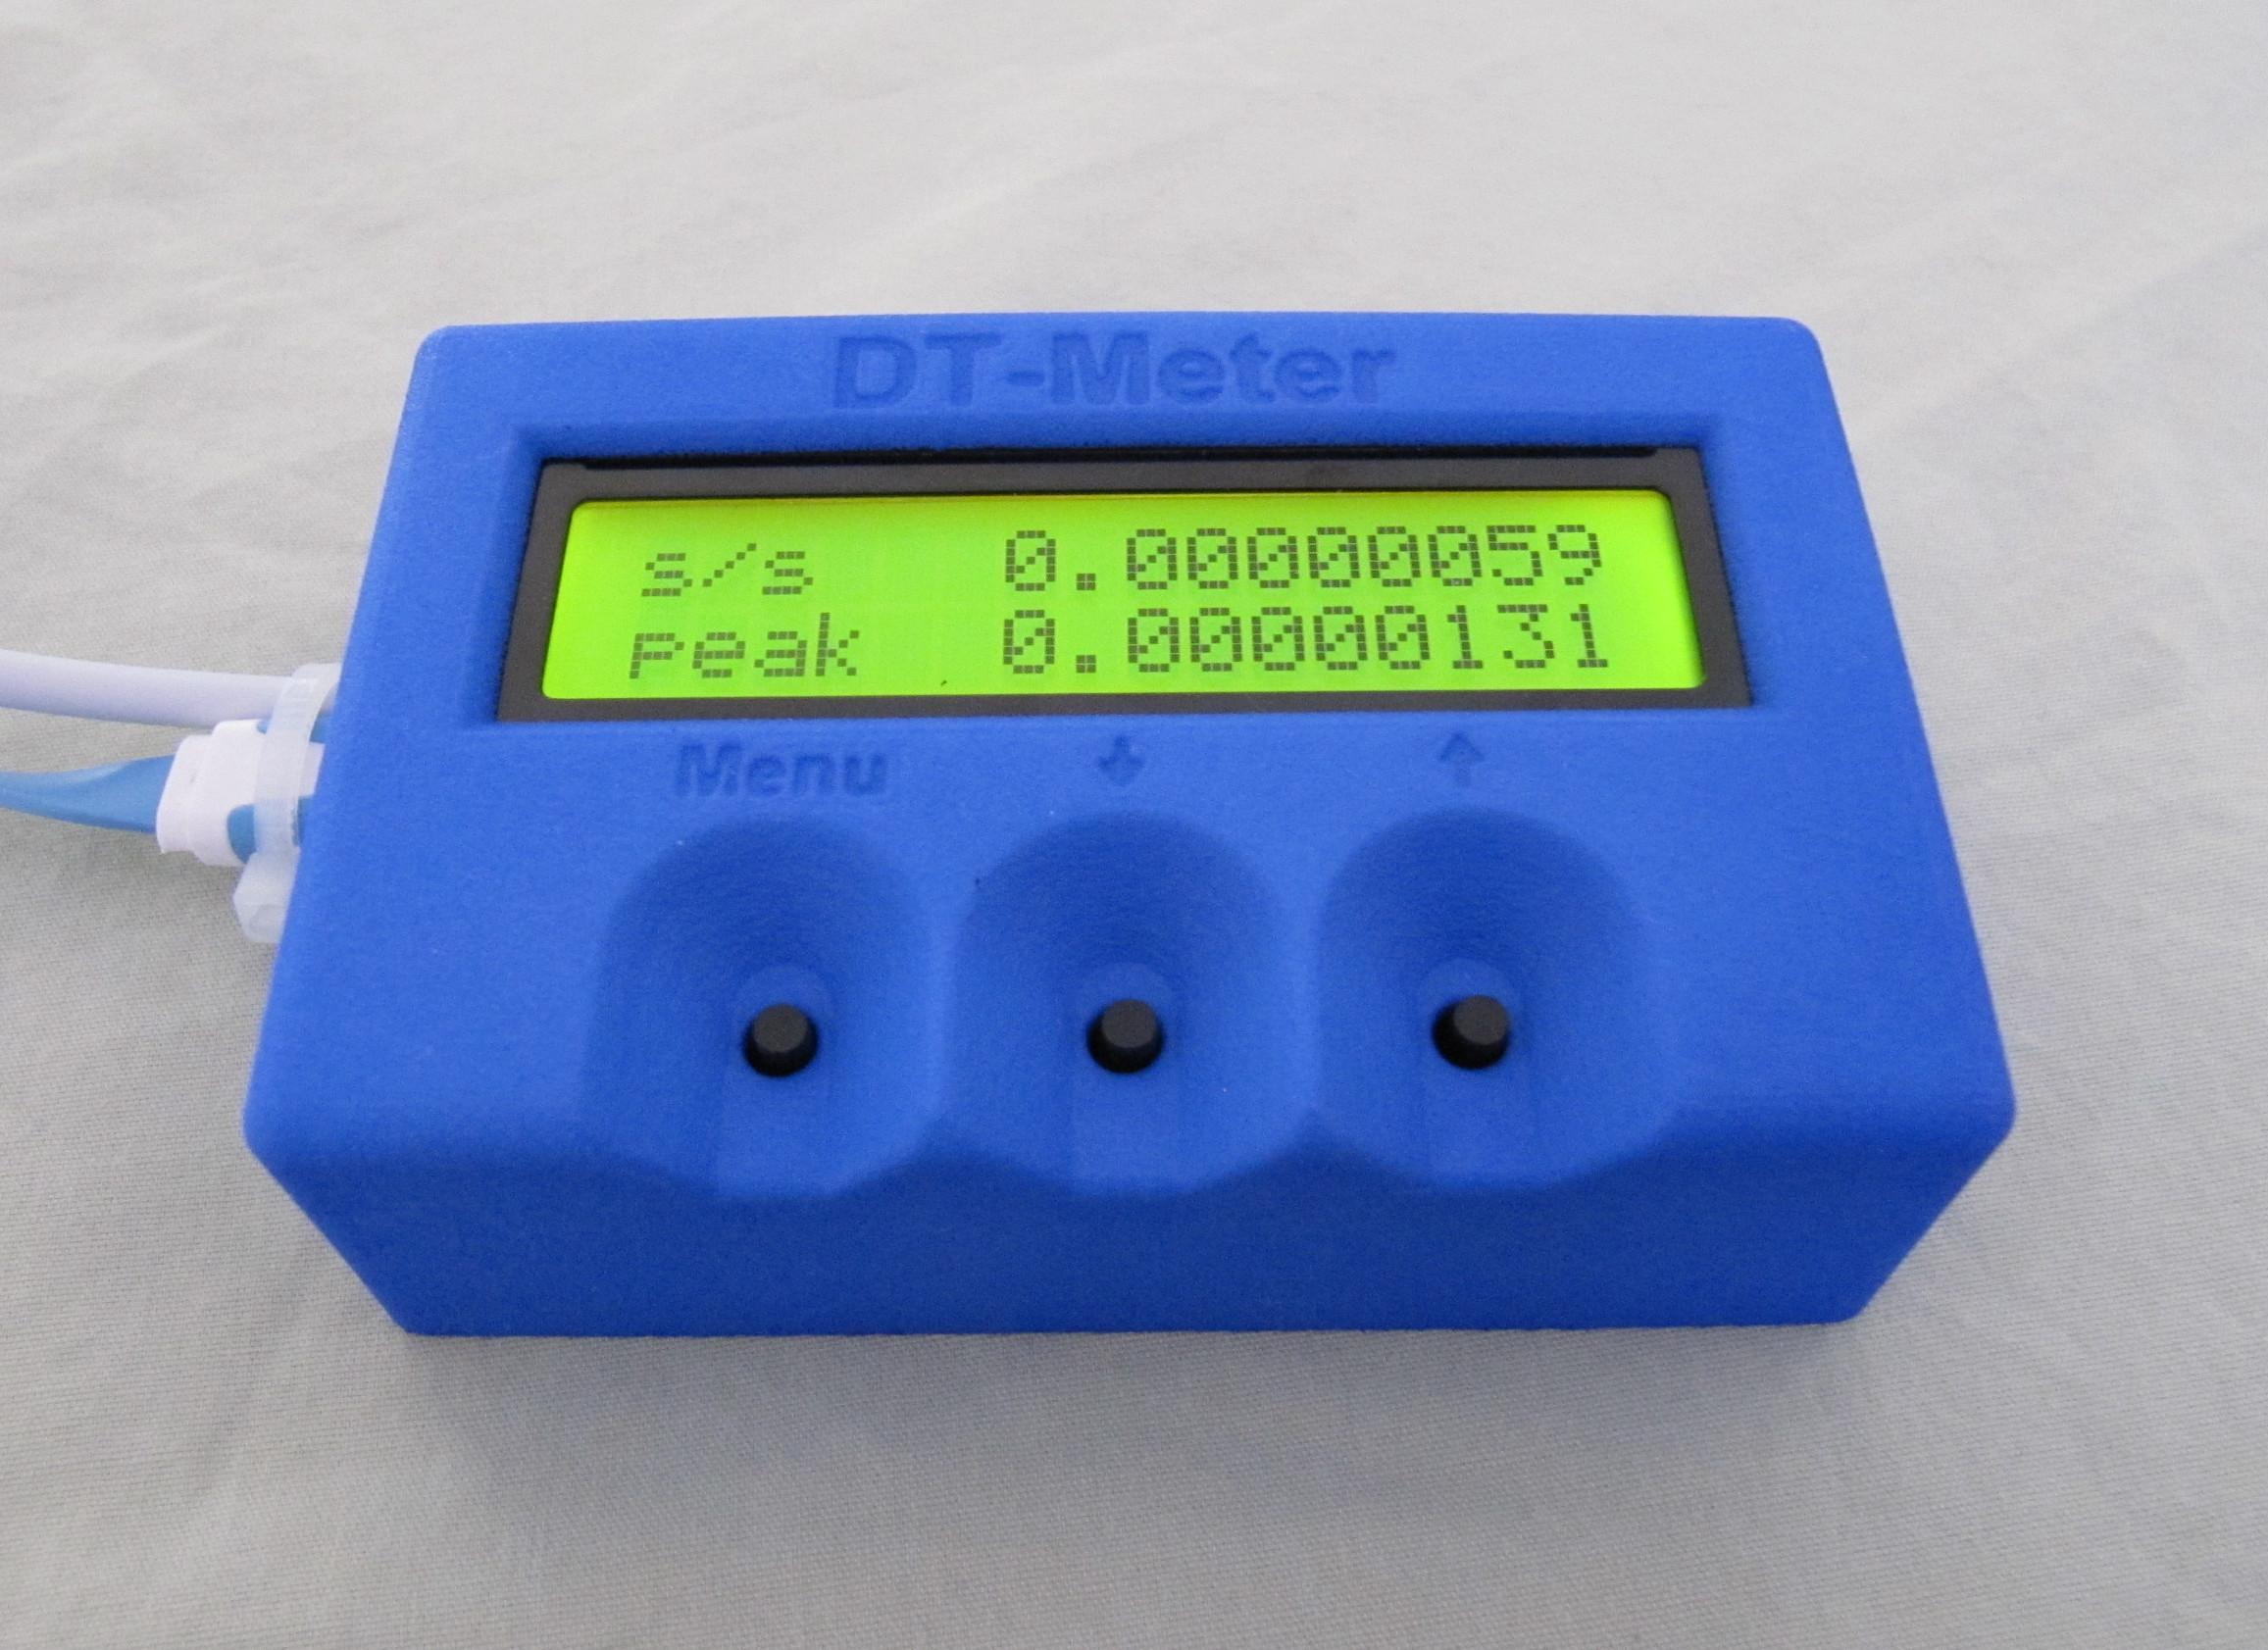
The DT-Meter will self calibrate for 6 seconds when it is first plugged in. After the auto-calibrate is complete, there will be a short beep each time that the reading becomes large enough to change the peak value. There are two values displayed, the top line is the present value that is updated twice per second. The top line has the label: “s/s” and then a number. The s/s is short for seconds per second, and is the difference in time rate averaged over the last 5 seconds.
The lower line is the peak value. The peak value will remain the same until the next calibrate, power-up, or until the present value becomes larger.
A 1:1 time rate where the two rates of time are the same will read 0.00000XXX where the XXX is noise and temperature drift that defines the limits of the meter sensitivity. A reading of 1.00000000 would be twice as fast, a reading of -1.00000000 would indicate that time had stopped (or the sensor plug is not installed). The reading represents the difference in the rate of time, displayed in seconds per second, and is updated twice each second. The maximum range of the DT-Meter is -1.00000000 (stopped) to 8.99999999 (9x). The farthest right digit represents 10s of nano-seconds (a nano-second is the count of a second split into a billion parts).
When used for monitoring the time-rate changes in a specific area: place the display unit indoors. Stretch out the cable so that the sensor unit (small pvc pipe section) is as far away from the display unit as possible. The sensor unit is water proof and may be buried. The cable should be protected from damage by pets or rodents. The easiest way to protect the cable is to run it just under the eves of the house. A more expensive cable protection would be conduit or pvc pipe (needs to be large enough for the connectors to fit through). After installation, power up the DT-Meter and it will auto-calibrate. You may leave the DT-Meter powered up and check the peak reading every once in a while. With normal temperature variations, the peak reading will be around +/- 0.00000600 after a few days and will stay at this reading for weeks if there are no anomalies detected. There will be a beep whenever the peak reading changes. The DT-Meter will sound long beeps when the reading becomes larger than the alarm limit.
For field use, or to measure a stable anomaly: move the sensor close the display unit and power-up. Wait for the DT-Meter to auto-calibrate, then move the sensor away from the display unit while the power is still on. If there is a space-time anomaly, the reading will change as the sensor is moved.
The Buttons:
A short press of the menu button will turn the display back-light on and off.
The second line of text will change if you press and hold the menu button for a half second. If you press the menu button again, different menu selections will be displayed.
If there is no button pressed for around 5 seconds, the display will return to the peak value. If a menu item is displayed and allowed to sit for 5 seconds with no button presses, the value will be saved to the memory that will be read next power-up. If you change a setting and then change to a different menu item, the setting will change, but will revert to it’s previous value on the next power-up.
Bright: this menu item allows for the adjustment of the display brightness by using the up and down buttons.
Contrast: this menu item allows for the adjustment of the display contrast by using the up and down buttons.
Alarm: this menu item allows for the adjustment of the alarm magnitude by using the up and down buttons. The alarm setting will change by a decimal place for each press of the up/down buttons. When a difference in time rate greater than this value is detected, the DT-Meter will beep long beeps.
Up/Dn= calibrate: if you press the up or down button while this menu item is displayed, the DT-Meter will auto-calibrate.
Verification:
It is easy to verify that this meter performs as advertised. The sensor produces a 1.000000 megahertz 2v p-p square wave with an accuracy of +/-25ppm, when it is connected to the display unit where it is terminated with 75 ohms to match the cable. If you remove the BNC connector from the sensor and connect the display unit to a good quality function generator, you can verify that the correct reading is displayed for the simulated difference in time rate. Set the function generator to 1.000000mhz, turn on the DT-Meter and wait for it to auto-calibrate (6 seconds). Change the function generator to 1.001000mhz and the DT-Meter will read a time rate difference of 0.001 seconds per second. The DT-Meter should also beep continuously if you have not changed the alarm setting. Change the function generator to 999000.00 hertz and the DT-Meter will read a time rate difference of -0.001 seconds per second.
The formula that the DT-Meter uses is 1-(f1 / f2) where f1 is the larger value of the sensor frequency as seen at the display unit, or 1mhz, and f2 is the smaller of the sensor frequency as seen at the display unit, or 1mhz. The result is adjusted by a calibration that is set on power-up (or by user command). The reason for using this formula is because a display of 1.00000 seconds per second would change to 0.999999 whenever the sign changed, when what is desired is to know the magnitude of the difference and the sign. It is much better to watch the display change from -0.000001 to 0.000001 rather than from 1.00001 to 0.999999.
Optional Monitoring:
This meter has been designed to operate with no other device necessary. However, an RS-485 port for connecting to a computer has been provided. There is no software app at this time, and the USB to RS-485 adapter is not included. Example code for a monitoring program that will run on the Raspberry Pi, and other Linux operating systems, is available for free download:
There is no documentation yet, but the code has been running with two DT-Meters attached for many months now. The rs232.c and rs232.h were written by Teunis van Beelen. You may do a right click and a “save as”:
The advantage of using a Raspberry Pi is that it will keep running without going to sleep and it requires very little power to monitor the DT-Meter 24-7.
Please see the complete user manual that is also available for download.
The Manual:
The manual is available from www.rhwebco.com/DT-Meter_Manual.pdf
frequently asked questions:
Why use a DT-Meter to detect UFOs?
Every other type of detector will also detect things that are used during our ordinary lives. RF detectors will detect our cell phones. Magnetometers will also detect large metal trucks going by. Gravimeters will also detect people walking past the sensor.
Nothing that we normally use will affect the rate of time as measured from two different points separated by 100 feet. If the sensor was sensitive enough, and the cable long enough, the gravitation of the earth and moon would become detectable, but these effects are very small compared to the resolution of the DT-Meter. This means that there should be no false alarms. Any detection above the noise is either unknown technology, or a broken meter.
Has anyone used one before?
During an episode of the X-Files, agent Moulder investigated a UFO sight by placing one stopwatch near his car and then carrying another stopwatch with him. When he got back to his car, he compared the two stopwatches and the elapsed time was different. If you chopped each second into a million pieces, then counted each piece, that is what this DT-Meter will do for you.
Why doesn’t the meter read exactly 0.0000?
Everything that can be built has noise. The components of this meter were selected to have the lowest noise, jitter and thermal drift specifications that are available within this price range. The digital electronics were designed to have plenty of resolution so that the smallest measurable change will be displayed.
Why is there a cable instead of blue-tooth?
The 1mhz signal needs to be reliably read at the display unit. Each pulse is counted and will effect the reading. Blue tooth or other wireless formats would not be able to accurately support this signal.
Why 100 feet?
This is a standard length for a security camera cable, and is around the right length to reach from a customer’s house to the edge of their property. It is best to have as much distance between the sensor and the display unit as possible, so you may extend the distance by another 100 feet with a standard security camera cable, if you have enough space to do this.
Why not get rid of the cable by using satellites?
The first thing that happens in most reported events is that radio reception is lost. Under the best conditions with an outdoor antenna, reception is not 100%.
What is the best location for the sensor?
The best location would be 100 feet straight up or down. The ideal place would be at the bottom of a well that has gone dry. Unfortunately, this is not always able to be done. The best location for most people is to place the sensor at the farthest distance that is available at your house. The sensor is designed for outdoor, or under-ground operation. Protection from direct sunlight and temperature extremes should be provided.
If you put the sensor into a box that is exposed to sunlight, the box should have holes to allow air flow (so that the sensor will not get too hot). If you bury the sensor below ground, the cable should be protected against possible puncture or crushing. One way to do this is to fill the hole with sand that is free from rocks, after the sensor has been placed into the hole.
Suppose that a UFO flew over from the direction that the sensor is placed. According to the most plausible theories, the magnitude of the distortion of space-time will decrease as the distance from the UFO increases, according to the inverse square law. As the UFO flies over the sensor, the time rate at the sensor will change more than the time rate at the display unit. This means that if the cable between the sensor and the display unit was perpendicular to the direction of travel of the UFO, the peak reading would be less than if the cable was parallel with the direction of travel, so it would be desirable to have two DT-Meters with their cables placed at right angles to each other. If the sensor was located 100 feet directly above or below the display unit, the peak reading would be when the UFO was directly above the display unit.
Why 1mhz?
Because clock oscillators rise in cost when the stability specification is better than 25 or 30 parts per million. The parts per million needs to be multiplied by 2 because there is an oscillator at the sensor and another one in the display unit. At 1Mhz, this is 60 counts per second and there is no need to measure the noise any more accurately than that. Also, the cost of the digital counters and cable drivers goes up as the frequency goes up. The displayed value is more stable and accurate than this specification because the counts are averaged over the last 5 seconds, and the specification is for the full temperature range of the oscillator.
Can it detect gravity waves?
No, sorry. The sensitivity is not high enough to detect gravity waves.
Could I use this in the field?
Yes. Be sure to power up and allow the DT-Meter to calibrate while the sensor and the display unit are close to each other. After calibration, move the display unit and sensor away from each other to measure the difference in time rate. The power source is a standard USB connection. You may use a cell phone backup battery (not included) for field use, but the power required by the DT-Meter is very low and some models of backup batteries will turn off after a few seconds because no load is detected. If you leave the backlight for the display turned on, most brands of of batteries will stay on. The models of cell phone batteries that are most likely to work even if the display backlight is off, are the smaller ones that have a built in flash light. The USB
connection of a laptop will easily power your DT-Meter.
What does gravity have to do with the time rate?
If you ask 10 scientists, you will probably get 12 different theories. My theory can be read at www.modeltheatom.com
Can I make the drift less:
Yes. Place the sensor unit inside of a Styrofoam box along with bottles of water. The day to night temperature drift will be lower, so the drift of the DT-Meter will also be lower. You could also dig a 2 foot deep hole in the ground and bury the sensor (the temperature is more stable under-ground).
What is Ron Heath’s email address?
![]()
![]()